
Stories
Data-driven cricket journalism
Long-form stories grounded in statistics. History, tactics, venue analysis, and the numbers behind every era of English cricket.
Featured
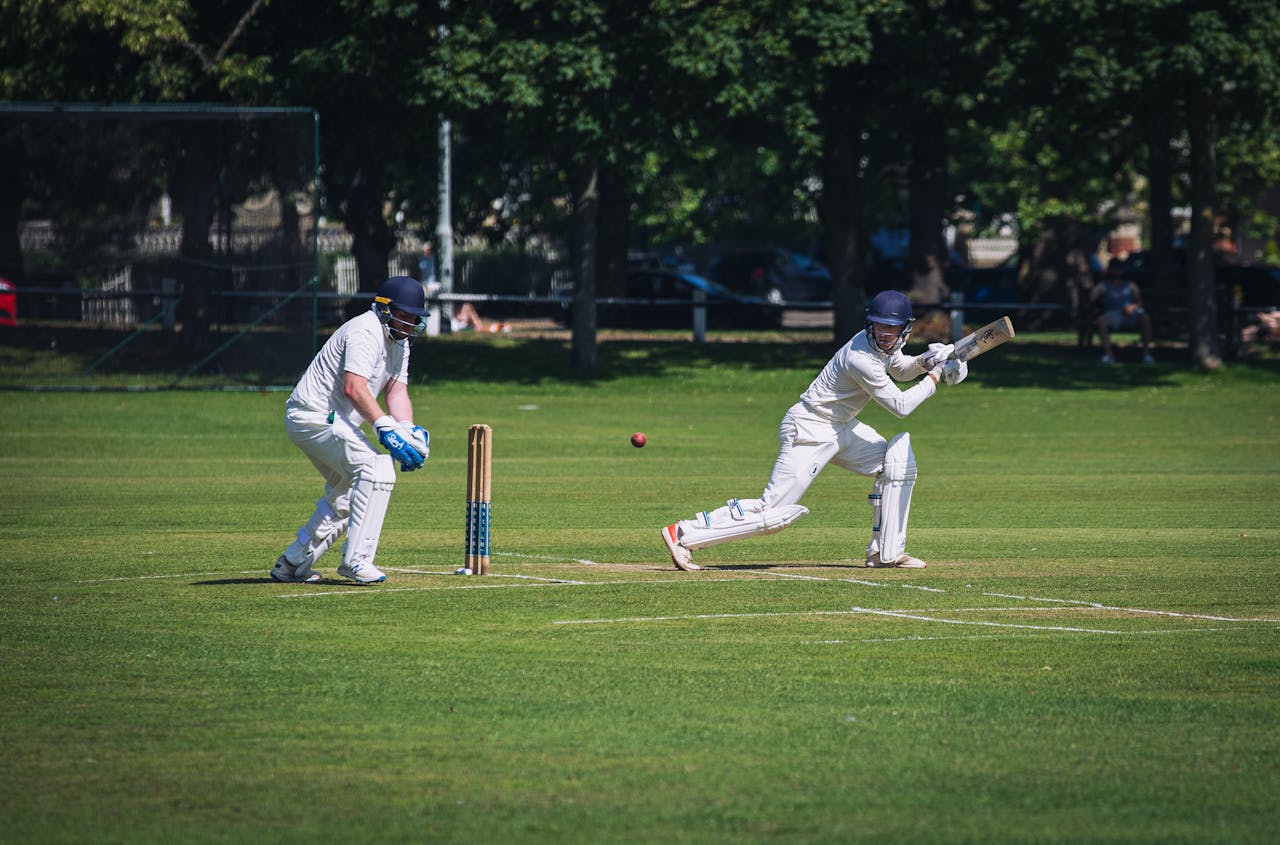
Why Bazball Changed England’s Run Rate Forever
In 2022, Ben Stokes and Brendon McCullum transformed England’s Test batting. The run rate rose from 3.1 to 4.4 per over — the steepest acceleration in Test history. We chart every innings to find where aggression ends and recklessness begins.
Read more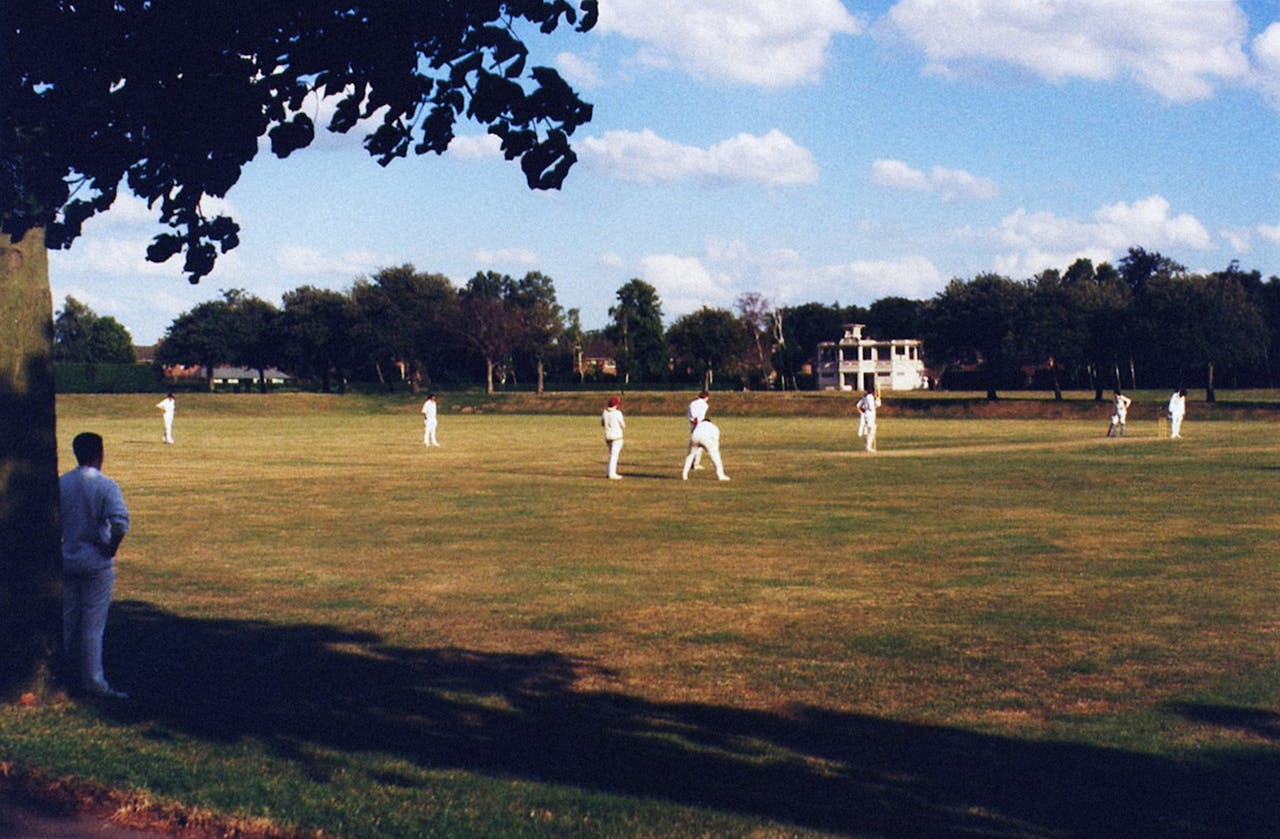
The Ashes at Lord’s: 142 Years of Data
Since 1884, England and Australia have played 38 Tests at Lord’s. We map every result, every century, every five-wicket haul across 142 years to find whether the “home of cricket” actually helps England.
How The Hundred’s Impact Shows in County Championship Batting
Since The Hundred launched in 2021, County Championship scheduling compressed into two split blocks. We compare pre-Hundred and post-Hundred batting averages, first-innings totals, and draw rates to see whether fatigue and overlap are measurable in the data.

Bowling Economy in Test Cricket: A 30-Year Trend
Bowling economies in Test cricket have risen from 2.6 per over in the 1990s to 3.4 in the 2020s. Is this Bazball? Flat pitches? Shorter boundaries? We decompose the data decade by decade and isolate the variables.

The County Championship: Does It Still Produce Test Cricketers?
In the 1990s, 84% of England debutants had 50+ County Championship caps. By 2025, that figure dropped to 41%. We trace the pathway from county cricket to international selection and ask whether domestic cricket’s role has changed forever.

Six Venues, Six Personalities: How English Pitches Shape Test Results
Lord’s favours batsmen. Headingley favours seamers. Edgbaston produces results. We build a venue personality profile from 50 years of pitch data — slope, bounce, swing, turn.
Spin in England: Why Wrist Spinners Now Average Under 30
Finger spinners dominated English cricket for decades. But since 2018, wrist spinners in County Championship cricket have averaged 28.4 compared to finger spinners’ 34.1. We investigate what changed — surfaces, coaching, or selection?
The Bodyline Series Revisited: What Modern Data Tells Us
The 1932–33 Ashes remain cricket’s most controversial series. We reconstruct Jardine’s leg-theory strategy using modern wagon-wheel analysis and short-ball frequency data to understand just how extreme it really was.
Partnership Data: Why Stands of 100+ Have Declined 18% Since 2015
Century partnerships in Test cricket have dropped from an average of 4.2 per series in 2010–15 to 3.4 in 2020–25. Bazball gets the blame, but the data shows a global trend. We investigate.
Tactical Analysis · 10 min read
Why Bazball Changed England’s Run Rate Forever
In 2022, Ben Stokes and Brendon McCullum transformed England’s Test batting. The run rate rose from 3.1 to 4.4 per over — the steepest acceleration in Test history. We chart every innings to find where aggression ends and recklessness begins.
Full article coming soon. This is a preview of Throsmex editorial content.
Historical · 14 min read
The Ashes at Lord’s: 142 Years of Data
Since 1884, England and Australia have played 38 Tests at Lord’s. We map every result, every century, every five-wicket haul across 142 years to find whether the “home of cricket” actually helps England.
Full article coming soon. This is a preview of Throsmex editorial content.
Research · 9 min read
How The Hundred’s Impact Shows in County Championship Batting
Since The Hundred launched in 2021, County Championship scheduling compressed into two split blocks. We compare pre-Hundred and post-Hundred batting averages, first-innings totals, and draw rates to see whether fatigue and overlap are measurable in the data.
Full article coming soon. This is a preview of Throsmex editorial content.
Data Trend · 11 min read
Bowling Economy in Test Cricket: A 30-Year Trend
Bowling economies in Test cricket have risen from 2.6 per over in the 1990s to 3.4 in the 2020s. Is this Bazball? Flat pitches? Shorter boundaries? We decompose the data decade by decade and isolate the variables.
Full article coming soon. This is a preview of Throsmex editorial content.
Structural · 12 min read
The County Championship: Does It Still Produce Test Cricketers?
In the 1990s, 84% of England debutants had 50+ County Championship caps. By 2025, that figure dropped to 41%. We trace the pathway from county cricket to international selection and ask whether domestic cricket’s role has changed forever.
Full article coming soon. This is a preview of Throsmex editorial content.
Venue Analysis · 8 min read
Six Venues, Six Personalities: How English Pitches Shape Test Results
Lord’s favours batsmen. Headingley favours seamers. Edgbaston produces results. We build a venue personality profile from 50 years of pitch data — slope, bounce, swing, turn.
Full article coming soon. This is a preview of Throsmex editorial content.
Tactical Analysis · 9 min read
Spin in England: Why Wrist Spinners Now Average Under 30
Finger spinners dominated English cricket for decades. But since 2018, wrist spinners in County Championship cricket have averaged 28.4 compared to finger spinners’ 34.1. We investigate what changed — surfaces, coaching, or selection?
Full article coming soon. This is a preview of Throsmex editorial content.
Historical · 15 min read
The Bodyline Series Revisited: What Modern Data Tells Us
The 1932–33 Ashes remain cricket’s most controversial series. We reconstruct Jardine’s leg-theory strategy using modern wagon-wheel analysis and short-ball frequency data to understand just how extreme it really was.
Full article coming soon. This is a preview of Throsmex editorial content.
Data Trend · 10 min read
Partnership Data: Why Stands of 100+ Have Declined 18% Since 2015
Century partnerships in Test cricket have dropped from an average of 4.2 per series in 2010–15 to 3.4 in 2020–25. Bazball gets the blame, but the data shows a global trend. We investigate.
Full article coming soon. This is a preview of Throsmex editorial content.
Weekly cricket data highlights
No spam, no tips, just numbers.